
Introduction
Although IFRS 17 has replaced IFRS 4 for most insurers for annual reporting periods beginning on or after January 1, 2023, understanding the Liability Adequacy Test under IFRS 4 remains valuable when reviewing historical financial statements, transition balances, legacy reporting, and actuarial methodologies.
This guide explains how the test worked, how actuaries reviewed insurance liabilities, how discounted cash flow models supported the analysis, and how the approach differs from IFRS 17 insurance contract liabilities.
What Is the Liability Adequacy Test Under IFRS 4?

The Liability Adequacy Test (LAT) was an assessment used under IFRS 4 to determine whether the carrying amount of an insurer’s insurance liabilities was sufficient, based on estimated future cash flows.
In simple terms, the insurer compared its recorded insurance liability with the present value of expected future cash flows, considering relevant future claims, benefits, expenses, and other contractual obligations.
If the existing liability was insufficient, the insurer generally had to recognise the deficiency in profit or loss under applicable IFRS 4 requirements.
The test therefore connected three important areas:
- Insurance contract liabilities
- Actuarial estimates of future cash flows
- Financial reporting and profit recognition
The underlying principle was straightforward: an insurer should not report an insurance liability that is materially below the amount required to meet its expected contractual obligations.
Why Was the Liability Adequacy Test Important?
Insurance liabilities often involve payments that occur years or decades after the reporting date. An insurer therefore cannot assess adequacy simply by looking at current claims or premiums.
Actuaries need to estimate:
- Future claims and benefits
- Claim settlement expenses
- Policyholder behavior
- Lapse and surrender rates
- Mortality and morbidity
- Future expenses
- Inflation
- Timing of cash flows
- Discount rates
- Other relevant contractual obligations
A change in any of these assumptions can materially affect the estimated liability.
The LAT provided a structured way to identify potential deficiencies before they became hidden balance-sheet problems.
Key Components of an IFRS 4 Liability Adequacy Review
https://templorix.com/assured-career-progression-a-guide-to-career-growth/
A robust actuarial reserve review typically considers several components.
| Component | Purpose |
| Existing insurance liability | Establishes the carrying amount being tested |
| Best estimate cash flows | Estimates expected future claims, benefits, expenses, and other relevant cash flows |
| Discounting | Converts future cash flows into a present-value amount where applicable |
| Policyholder assumptions | Reflects lapse, surrender, mortality and other behavioral assumptions |
| Expense assumptions | Estimates future costs associated with fulfilling obligations |
| Risk considerations | Captures uncertainty and adverse development where required |
| Premium information | Helps assess future inflows and the overall economics of the contracts |
| Actuarial review | Tests the reasonableness, completeness, and support for assumptions |
The precise requirements depend on the relevant contracts, accounting policies, and applicable IFRS 4 requirements.
How Does the Liability Adequacy Test Work?

The basic concept can be expressed as:
Estimated present value of future cash outflows and other relevant obligations − relevant future cash inflows = net future liability requirement
The insurer then compares this requirement with the liability already recognised.
A simplified conceptual calculation is:
LAT Deficiency = Required Liability − Carrying Amount of Insurance Liability
If the result is positive, the analysis indicates a potential deficiency.
For example:
| Item | Illustrative Amount |
| Present value of expected claims | $720 million |
| Present value of expenses | $90 million |
| Other expected outflows | $40 million |
| Present value of relevant future inflows | ($760 million) |
| Estimated net liability requirement | $90 million |
| Existing liability | $75 million |
| Illustrative deficiency | $15 million |
This is a simplified educational example rather than a complete IFRS 4 accounting calculation. Actual LAT assessments require contract-specific analysis and consideration of the applicable accounting requirements.
Step 1: Establish the Existing Liability
The first step is to identify the insurance liabilities already recognised in the financial statements.
The actuarial team should reconcile the opening liability to the general ledger and investigate significant movements during the reporting period.
This reconciliation can identify:
- New business
- Claims paid
- Claims incurred
- Premium movements
- Reserve releases
- Assumption changes
- Methodology changes
- Foreign exchange effects
- Other accounting adjustments
A reserve review becomes much more reliable when the actuarial model and financial reporting records reconcile.
Step 2: Develop Best Estimate Cash Flows
The next step involves developing best estimate cash flows for insurance contracts.
- Claim payments
- Death benefits
- Maturity benefits
- Disability benefits
- Annuity payments
- Policyholder expenses
- Claims handling expenses
- Acquisition-related amounts where relevant
- Future premiums or other contractual inflows
The actuarial team should document the assumptions supporting each material cash-flow component.
Disaggregation of Actuarial Cash Flow Assumptions
A useful reserve review separates assumptions rather than treating the model as a single black box.
For example:
| Assumption | Potential Impact |
| Mortality | Changes expected benefit payments |
| Morbidity | Changes disability or health claims |
| Lapse | Changes future premiums and benefits |
| Inflation | Changes claims and expenses |
| Expense inflation | Changes future operating costs |
| Claim settlement pattern | Changes timing of cash outflows |
| Discount rate | Changes present value |
| Policyholder behavior | Changes future contractual cash flows |
This disaggregation makes the model easier to audit and stress test.
Building a Discounted Cash Flow Actuarial Model
A discounted cash flow actuarial model converts expected future cash flows into a present-value estimate.
A simplified formula is:
PV = Σ [CFₜ / (1 + rₜ)ᵗ]
Where:
- PV = present value
- CFₜ = expected cash flow at period t
- rₜ = applicable discount rate
- t = time period
Real actuarial models can be considerably more sophisticated. They may use yield curves, stochastic assumptions, monthly cash flows, policy-level projections, and multiple economic scenarios.
Discount Rate Curves and Risk-Free Rates

Discount rates can have a significant effect on long-duration insurance liabilities.
Generally, a higher discount rate reduces the present value of future cash outflows, while a lower discount rate increases it, all else being equal.
However, the relationship is not always straightforward because insurance portfolios contain different cash-flow patterns and financial risks.
A reserve review should therefore document:
- The source of the discount curve.
- The valuation date.
- Currency.
- Duration assumptions.
- Method used to interpolate or extrapolate rates.
- Any applicable adjustments.
- Sensitivity to rate movements.
The 4-Step DCF Stress Test Framework
The following framework can help actuarial and financial reporting teams perform a structured stress test of liability adequacy.
Step 1: Establish the Base Case
Start with the approved best-estimate assumptions.
Calculate:
Base Liability = Present Value of Expected Future Cash Flows
Record the corresponding carrying amount of the insurance liability.
Step 2: Apply Assumption Shocks
Stress material assumptions to determine how sensitive the liability is to adverse developments.
For example, an internal sensitivity analysis could test:
- Mortality: +10%
- Morbidity: +10%
- Favorable mortality: -15%
- Claims inflation: +5%
- Lapse rates: adverse scenario
- Discount rates: parallel increase or decrease
These percentages are illustrative stress-test parameters, not IFRS-prescribed LAT assumptions.
The purpose is to understand model sensitivity rather than to replace the required actuarial assumptions.
Step 3: Recalculate the Present Value
Run the model again using the stressed assumptions.
For example:
| Scenario | Required Liability | Existing Liability | Illustrative Result |
| Base case | $500m | $510m | $10m surplus |
| Claims +10% | $545m | $510m | $35m shortfall |
| Inflation +5% | $530m | $510m | $20m shortfall |
| Discount rate -1% | $560m | $510m | $50m shortfall |
These figures are hypothetical and demonstrate the mechanics of sensitivity analysis.
Step 4: Analyze the Deficiency
If the required liability exceeds the carrying amount, the actuarial and accounting teams should investigate:
- Which assumption caused the movement?
- Is the assumption supported by recent experience?
- Did economic conditions change?
- Did claims develop differently from expectations?
- Did policyholder behavior change?
- Does the model contain errors?
- Does the accounting treatment require recognition of a deficiency?
The accounting entry must then be determined under the applicable reporting framework and facts.
Premium Deficiency Reserve and Unearned Premium Reserve Adequacy
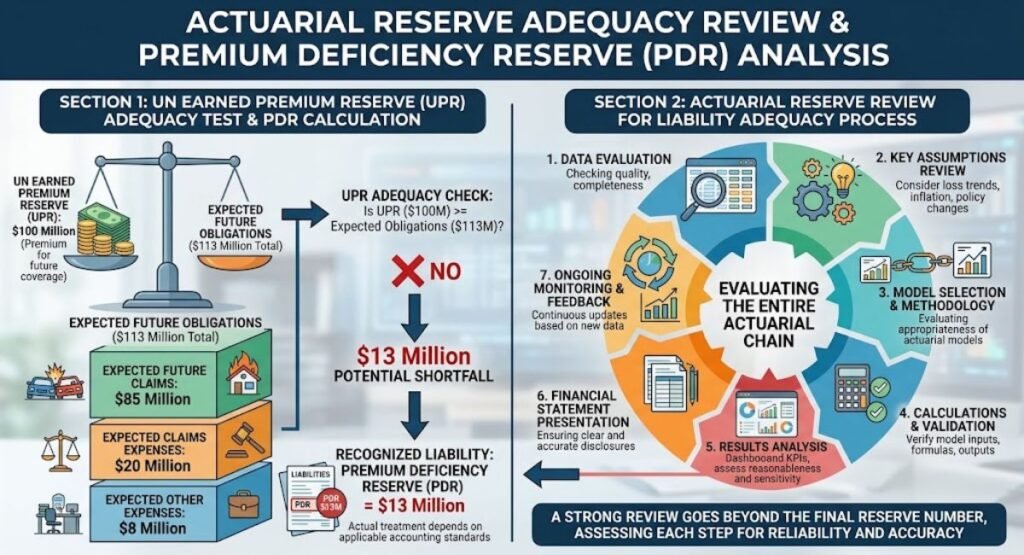
The concepts of Premium Deficiency Reserve (PDR) and Unearned Premium Reserve (UPR) adequacy are particularly relevant in property and casualty insurance discussions.
An unearned premium reserve represents premium relating to coverage that has not yet been earned.
However, an insurer should not assume that the UPR automatically represents an adequate liability for future coverage obligations.
For example, suppose an insurer has:
- UPR: $100 million
- Expected future claims: $85 million
- Expected claims expenses: $20 million
- Expected other expenses: $8 million
The expected future obligations total $113 million.
A simple comparison would show:
$113m expected obligations − $100m UPR = $13m potential shortfall
The actual accounting treatment depends on the applicable standard and circumstances. The example illustrates why reserve adequacy analysis needs to consider expected future obligations rather than relying solely on the UPR balance.
Actuarial Reserve Review for Liability Adequacy
An Actuarial Reserve Review for Liability Adequacy process should examine more than the final reserve number.
A strong review evaluates the entire chain from data to assumptions, model calculations, results and financial statements.
Data Validation
The team should test:
- Policy counts
- Premiums
- Claims
- Payment histories
- Exposure information
- Benefit amounts
- Policy characteristics
- Historical development
Assumption Review
Actuaries should compare assumptions against:
- Historical experience
- Recent trends
- Management expectations
- External economic information
- Portfolio characteristics
- Relevant regulatory requirements
Model Validation
The review should examine:
- Formula logic
- Cash-flow timing
- Discounting
- Projection periods
- Policyholder behavior
- Model changes
- Data mapping
- Reconciliation controls
Historical Claim Payout Patterns
Historical claim payout patterns can help actuaries understand how quickly liabilities develop and settle.
For example, a P&C portfolio might demonstrate:
| Development Period | Cumulative Paid Claims |
| Year 1 | 45% |
| Year 2 | 68% |
| Year 3 | 82% |
| Year 4 | 91% |
| Year 5 | 96% |
These figures are illustrative. Actual development patterns vary substantially by line of business and portfolio.
LAT vs IFRS 17 Measurement Models
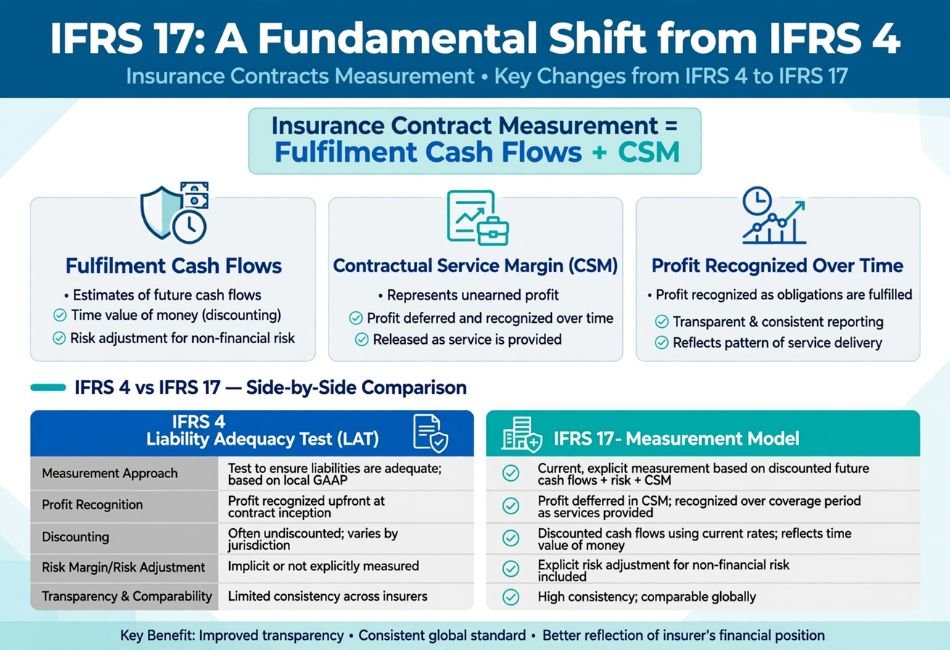
One of the most important distinctions is that IFRS 17 fundamentally changed the measurement and presentation of insurance contracts.
IFRS 17 measures groups of insurance contracts using fulfilment cash flows plus, where applicable, a contractual service margin. The fulfilment cash flows include estimates of future cash flows, adjustments for the time value of money and financial risks, and a risk adjustment for non-financial risk.
| Area | IFRS 4 LAT | IFRS 17 |
| Overall approach | Liability adequacy assessment within IFRS 4 | Comprehensive measurement model |
| Future cash flows | Used in adequacy assessment | Core component of fulfilment cash flows |
| Discounting | Depends on applicable IFRS 4 accounting policies and contracts | Current measurement requirements apply |
| Risk | Considered within applicable adequacy methodology | Explicit risk adjustment for non-financial risk |
| Unearned profit | Not represented through an IFRS 17-style CSM | Contractual Service Margin represents unearned profit |
| Loss-making contracts | Deficiency recognized under applicable requirements | Onerous groups generate immediate loss recognition |
| Measurement updates | Based on applicable IFRS 4 requirements | Fulfilment cash flows are updated at reporting dates |
IFRS 17 explicitly separates the measurement of fulfilment cash flows from the contractual service margin, which represents the unearned profit that is recognised as insurance services are provided.
Evolution of Reserving: From IFRS 4 LAT to IFRS 17 Fulfilment Cash Flows
IFRS 4 was an interim standard. It allowed insurers to continue using many existing accounting policies for insurance contracts, subject to specific requirements.
IFRS 17 introduced a more comprehensive measurement framework.
Under IFRS 17, fulfilment cash flows represent estimates of amounts the insurer expects to collect and pay, adjusted for the timing and risk associated with those amounts.
The new framework also introduces the Contractual Service Margin (CSM), which represents unearned profit and generally prevents that profit from being recognised immediately when coverage has not yet been provided.
For onerous groups of insurance contracts, IFRS 17 requires losses to be recognised immediately rather than creating a negative CSM.
Solvency II vs Insurance Liability Adequacy
Solvency II and IFRS financial reporting have different objectives.
Solvency II primarily focuses on regulatory capital and financial resilience, while IFRS 17 focuses on financial reporting and performance measurement. The IFRS Foundation notes that both frameworks can involve future cash flows, discount rates, and risk adjustments, but IFRS 17 also includes the contractual service margin.
Therefore, an insurer should not automatically treat a Solvency II technical provision as equivalent to an IFRS insurance liability.
A reconciliation may be necessary to understand differences in:
- Discount rates
- Contract boundaries
- Expenses
- Risk adjustments
- Cash-flow assumptions
- Profit recognition
- Regulatory margins
- Accounting presentation
Life and Health Insurance Balance Sheet Stress Testing
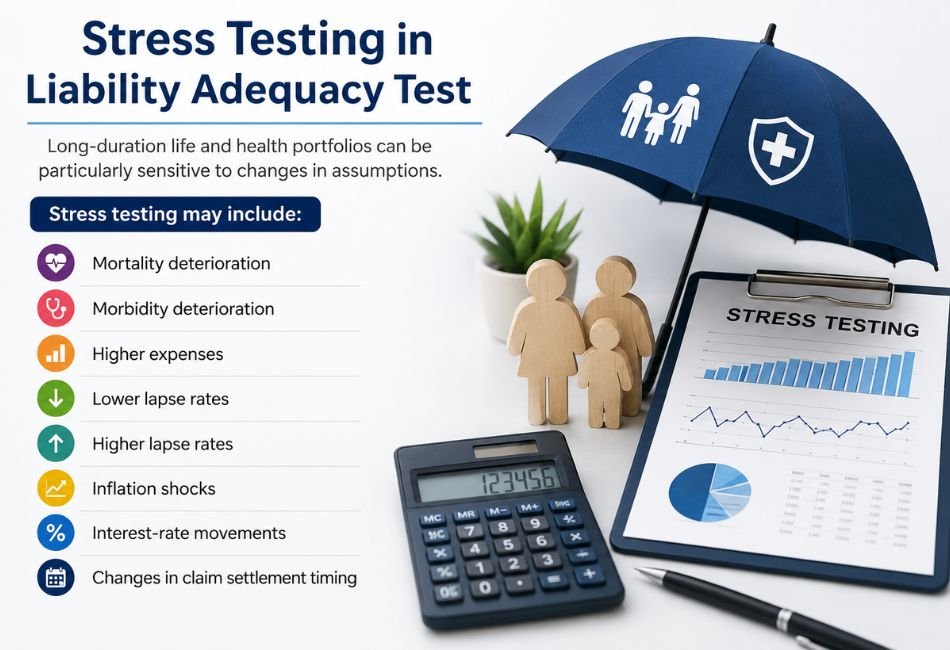
Long-duration life and health portfolios can be particularly sensitive to changes in assumptions.
Stress testing may include:
- Mortality deterioration
- Morbidity deterioration
- Higher expenses
- Lower lapse rates
- Higher lapse rates
- Inflation shocks
- Interest-rate movements
- Changes in claim settlement timing
The objective is not to predict a single outcome. Instead, stress testing helps management understand the range of possible balance-sheet outcomes.
Illustrative Case Study: Rapid Rate Changes and Liability Deficiencies
Consider an anonymized hypothetical life insurer with a long-duration portfolio.
At the beginning of the analysis:
| Measure | Base Position |
| Existing insurance liability | $1.20bn |
| Estimated future claims and benefits | $1.35bn |
| Expected future expenses | $100m |
| Expected future inflows | ($200m) |
| Discounted net requirement | $1.25bn |
| Illustrative shortfall | $50m |
The insurer discovers that its previous assumptions understated the effect of changes in policyholder behavior and future expenses.
The important lesson is not the specific $50 million amount. It is that small changes in assumptions can create large absolute movements when an insurer manages a very large long-duration portfolio.
The example is hypothetical and should not be interpreted as a documented historical insurer result.
Why Rapid Rate Movements Can Create Review Challenges
Interest-rate changes can affect:
- Present values
- Asset values
- Liability values
- Asset-liability management
- Policyholder behavior
- Reinvestment assumptions
- Hedging strategies
The effect on the liability side depends on the duration and structure of the projected cash flows.
Consequently, actuarial teams should not evaluate discount-rate sensitivity in isolation.
Common Actuarial Audit Pitfalls in LAT Assumptions
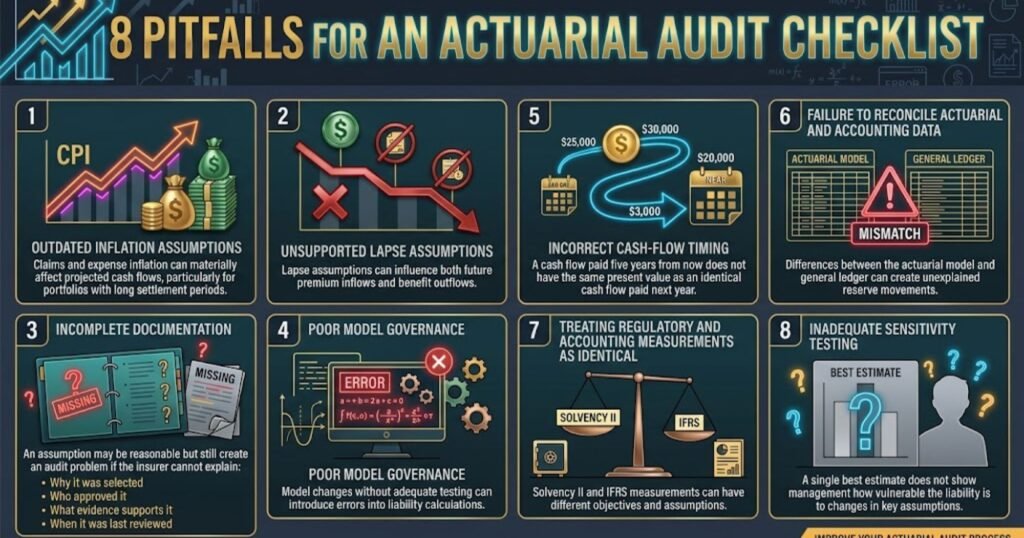
The following pitfalls are useful areas for an actuarial audit checklist.
1. Outdated Inflation Assumptions
Claims and expense inflation can materially affect projected cash flows, particularly for portfolios with long settlement periods.
2. Unsupported Lapse Assumptions
Lapse assumptions can influence both future premium inflows and benefit outflows.
3. Incomplete Documentation
An assumption may be reasonable but still create an audit problem if the insurer cannot explain:
- Why it was selected
- Who approved it
- What evidence supports it
- When it was last reviewed
4. Poor Model Governance
Model changes without adequate testing can introduce errors into liability calculations.
5. Incorrect Cash-Flow Timing
A cash flow paid five years from now does not have the same present value as an identical cash flow paid next year.
6. Failure to Reconcile Actuarial and Accounting Data
Differences between the actuarial model and general ledger can create unexplained reserve movements.
7. Treating Regulatory and Accounting Measurements as Identical
Solvency II and IFRS measurements can have different objectives and assumptions.
8. Inadequate Sensitivity Testing
A single best estimate does not show management how vulnerable the liability is to changes in key assumptions.
Benchmarking Data: How to Use It Responsibly
A useful LAT benchmarking exercise can classify findings by cause, such as:
| Potential Review Issue | Example Classification |
| Inflation assumption | Economic assumption |
| Lapse assumption | Policyholder behavior |
| Mortality assumption | Demographic assumption |
| Discount curve | Financial assumption |
| Data mapping | Data governance |
| Model logic | Model risk |
| Documentation | Governance/control |
The percentages in the original proposed methodology—such as 42% for outdated inflation assumptions and 31% for improper treatment of embedded options—should only be published as field-survey findings if the underlying dataset and methodology can be independently substantiated. They should not be presented as verified industry statistics without supporting evidence.
Accounting Entries and Deficiency Recognition
When an applicable adequacy assessment identifies a deficiency, the accounting team must determine the appropriate recognition under the applicable accounting requirements.
A simplified educational illustration could look like:
Dr. Insurance liability expense — $15 million
Cr. Insurance liability — $15 million
This example assumes that the applicable accounting framework requires the deficiency to be recognised through profit or loss.
The exact journal entry, account classification, presentation and measurement depend on the applicable reporting framework, contract type and accounting policies.
Under IFRS 17, the mechanics differ because onerous groups and changes in fulfilment cash flows interact with the contractual service margin and loss component requirements. IFRS 17 requires losses on onerous groups to be recognised immediately.
A Practical LAT Review Checklist
Before finalising a liability adequacy review, the team can ask:
- Is the insurance liability reconciled to the general ledger?
- Are all material cash flows included?
- Are assumptions supported by evidence?
- Are assumptions consistent with recent experience?
- Has inflation been reviewed?
- Have mortality and morbidity assumptions been reviewed?
- Have lapse and surrender assumptions been tested?
- Are cash-flow timings reasonable?
- Is the discount-rate methodology documented?
- Have sensitivities been performed?
- Have model changes been independently reviewed?
- Are actuarial and accounting results reconciled?
- Has management approved material assumptions?
- Has the financial reporting treatment been reviewed?
- If IFRS 17 applies, has the analysis been performed within the appropriate IFRS 17 measurement model?
How to Improve an Actuarial Reserve Review
A strong review combines actuarial expertise with financial reporting controls.
Use a Clear Assumption Governance Process
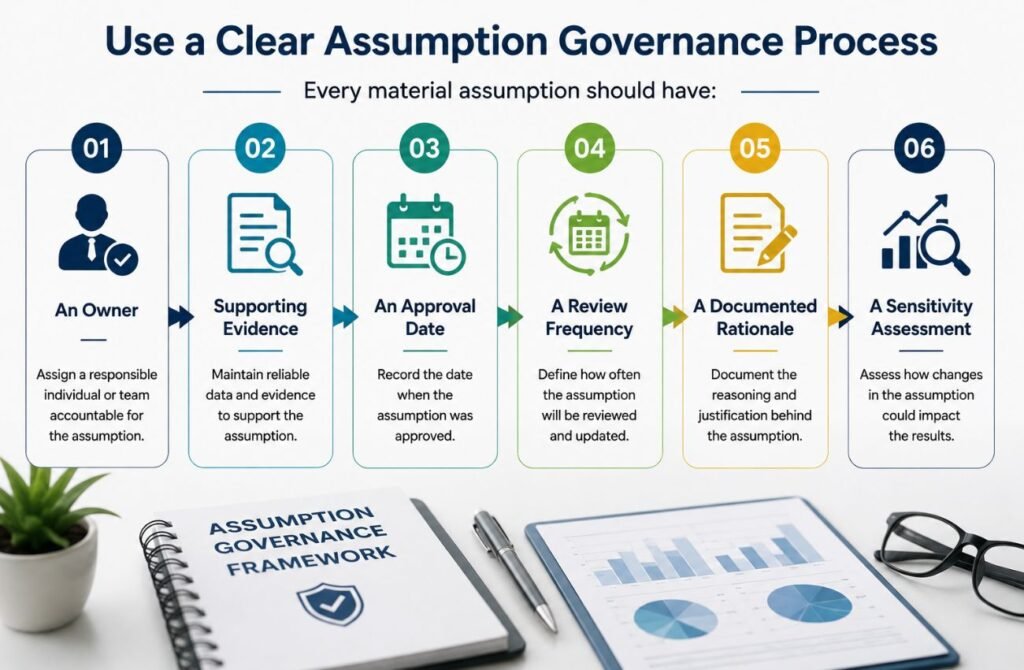
Every material assumption should have:
- An owner
- Supporting evidence
- An approval date
- A review frequency
- A documented rationale
- A sensitivity assessment
Separate Data, Assumptions and Model Risk
Do not treat every reserve movement as an assumption issue.
A change may arise from:
- Data quality
- Model methodology
- Economic assumptions
- Experience assumptions
- Accounting classification
- Actual claims development
Separating these causes makes management reporting much more useful.
Build Reproducible Calculations
A reserve calculation should allow another qualified reviewer to understand how the result was produced.
That means documenting:
- Inputs
- Calculations
- Outputs
- Overrides
- Model versions
- Controls
- Review procedures
Recommended Multimedia Assets
Complex insurance accounting becomes easier to understand when readers can see the process.
Interactive Liability Adequacy Calculator
A calculator can allow users to enter:
- Existing liability
- Expected claims
- Expected expenses
- Expected future inflows
- Discount rate
- Projection period
The calculator can then demonstrate the difference between the carrying amount and an illustrative discounted requirement.
IFRS 4 LAT vs IFRS 17 Infographic
A structural flowchart can show:
IFRS 4 → LAT adequacy assessment → deficiency analysis
versus:
IFRS 17 → Fulfilment Cash Flows + Risk Adjustment + CSM → Ongoing measurement
IFRS 17’s fulfilment cash flows incorporate future cash-flow estimates, time value of money and financial risk adjustments, plus a risk adjustment for non-financial risk.
Actuarial DCF Video Walkthrough
A short screen-share can demonstrate:
- Entering projected cash flows
- Applying discount rates
- Calculating present values
- Running sensitivity tests
- Comparing the result with the carrying amount
Deficiency Recognition Decision Tree
A process diagram can guide users through:
Review liability → Estimate future cash flows → Calculate required measurement → Compare with carrying amount → Identify deficiency → Apply applicable accounting treatment
Key Differences Between LAT and IFRS 17
The most important point is that IFRS 17 is not simply an updated version of the IFRS 4 LAT.
IFRS 17 introduced an integrated measurement model that uses fulfilment cash flows and, where applicable, the contractual service margin.
The contractual service margin represents profit that has not yet been earned and is recognised as the insurer provides insurance contract services.
Therefore, professionals reviewing historical IFRS 4 LAT results should avoid directly mapping every LAT calculation to an IFRS 17 liability without analyzing the differences in measurement, contract boundaries, risk adjustment, discounting and profit recognition.
Conclusion
The Liability Adequacy Test under IFRS 4 provided an important safeguard against reporting insurance liabilities that were insufficient to meet expected obligations. By comparing recognised liabilities with relevant estimates of future cash flows, insurers could identify potential deficiencies and address them through the applicable accounting process.
A high-quality actuarial reserve review requires more than running a model. It requires reliable data, defensible assumptions, appropriate discounting, documented methodology, sensitivity testing and effective reconciliation between actuarial and financial reporting systems.
Today, professionals must also understand the transition from IFRS 4 to IFRS 17 insurance contract liabilities. IFRS 17 introduced fulfilment cash flows, risk adjustment for non-financial risk and the contractual service margin, creating a more comprehensive framework for measuring and reporting insurance contracts.
FAQs
What is the Liability Adequacy Test under IFRS 4?
The Liability Adequacy Test was an IFRS 4 assessment designed to determine whether recognised insurance liabilities were adequate when compared with relevant estimates of future cash flows and obligations.
Is the Liability Adequacy Test still required under IFRS 17?
IFRS 17 replaced the IFRS 4 insurance-contract accounting model for most insurers. IFRS 17 has its own measurement requirements based on fulfilment cash flows and, where applicable, a contractual service margin.
What are fulfilment cash flows under IFRS 17?
Fulfilment cash flows represent estimates of future cash flows associated with insurance contracts, adjusted for the time value of money, relevant financial risks and a risk adjustment for non-financial risk.
What is the difference between LAT and IFRS 17?
LAT was an adequacy test under IFRS 4. IFRS 17 establishes a comprehensive measurement model for insurance contracts using fulfilment cash flows and, where applicable, the contractual service margin.
Why are discount rates important in insurance liability calculations?
Discount rates affect the present value of future cash flows. The longer the duration of the projected cash flows, the more significant discount-rate changes can become.
How do actuaries test liability adequacy?
Actuaries typically review data, assumptions, projected cash flows, discount rates, models, experience studies, and sensitivities before comparing the resulting liability requirement with the relevant carrying amount.