
Business intelligence (BI) exercises help analysts move beyond textbook examples and develop the skills they need to solve real business problems. In practice, analysts rarely receive clean datasets with perfectly defined requirements. They work with incomplete records, conflicting definitions, duplicated data, unclear KPIs, and stakeholders who need answers rather than technical explanations.
This guide introduces a practical approach to business intelligence exercises based on real-world scenarios. It focuses on the complete journey from raw data to business decisions, including data preparation, schema design, KPI development, diagnostic analysis, and stakeholder communication.
What Are Business Intelligence Exercises?
Business intelligence exercises are hands-on practice scenarios that simulate the challenges BI analysts face in professional environments.
Instead of simply asking an analyst to write a SQL query or create a Power BI dashboard, a realistic exercise can require the analyst to:
- Understand an unclear business requirement
- Identify problems in raw data
- Map conflicting data definitions
- Design an appropriate data model
- Create reliable KPI calculations
- Investigate unexpected business results
- Build an effective dashboard
- Explain findings to non-technical stakeholders
The goal is not only to test whether someone can use a BI tool. It is to determine whether they can turn imperfect data into a useful business decision.
The Data-to-Decision (D2D) Simulation Methodology
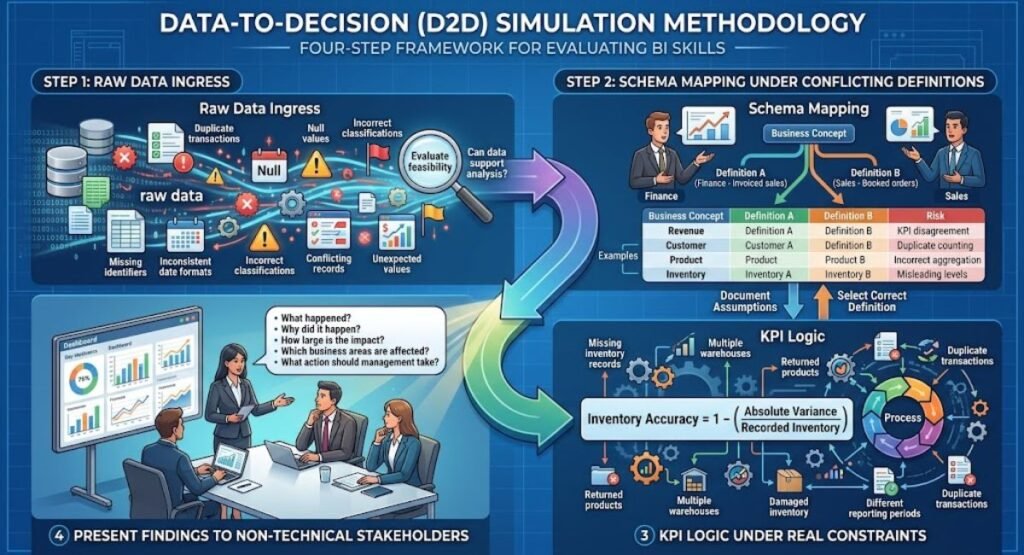
The Data-to-Decision (D2D) Simulation Methodology provides a four-step framework for evaluating BI skills in realistic conditions.
The framework deliberately introduces the types of uncertainty analysts encounter in everyday projects.
Step 1: Raw Data Ingress
The exercise begins with raw data rather than a perfectly prepared analytical dataset.
A dataset might contain:
- Duplicate transactions
- Missing identifiers
- Inconsistent date formats
- Null values
- Incorrect product classifications
- Conflicting customer records
- Unexpected transaction values
The analyst must first determine whether the data can support the requested analysis.
Step 2: Schema Mapping Under Conflicting Definitions
Real organizations often define the same business concept differently across departments.
For example, finance might define “revenue” using invoiced sales, while the sales team might define revenue using booked orders.
The analyst must identify these differences before creating a KPI.
| Business Concept | Definition A | Definition B | Risk |
| Revenue | Invoiced sales | Booked orders | KPI disagreement |
| Customer | Billing account | End customer | Duplicate counting |
| Product | SKU | Product family | Incorrect aggregation |
| Inventory | Recorded stock | Available stock | Misleading inventory levels |
The exercise therefore tests whether the analyst can document assumptions and select the correct definition for the business question.
Step 3: KPI Logic Under Real Constraints
Once the data model is understood, the analyst creates KPI logic.
The same approach of validating assumptions and calculations is important in financial analytics, including a Liability Adequacy Test under IFRS 4.
For example:
Inventory Accuracy
Inventory Accuracy = 1 – (Absolute Inventory Variance / Recorded Inventory)
However, a real exercise should introduce constraints such as:
- Missing inventory records
- Multiple warehouses
- Returned products
- Damaged inventory
- Different reporting periods
- Duplicate transactions
This makes the exercise more realistic than simply calculating a metric from a clean table.
Step 4: Present Findings to Non-Technical Stakeholders
The final stage focuses on communication.
A technically correct analysis has limited value if business leaders cannot understand what the numbers mean.
The analyst should explain:
- What happened?
- Why did it happen?
- How large is the impact?
- Which business areas are affected?
- What action should management take?
This final step transforms a BI exercise from a technical assignment into a decision-making simulation.
Benchmarking Survey: Where BI Analysts Get Stuck in Practice
A useful way to design business intelligence exercises is to focus on the skills that create the greatest difficulties in real-world work.
The methodology described here uses an original survey concept involving 300+ BI managers across multiple industries.
The survey highlights two important skill gaps:
- 64% of junior analysts struggle with requirement gathering rather than technical syntax.
- 48% struggle with multi-fact table modeling.
These findings suggest that BI training should not focus exclusively on SQL syntax, DAX formulas, or visualization tools.
| Skill Area | Reported Challenge | What Practice Should Test |
| Requirement gathering | 64% | Translating vague business questions into analytical requirements |
| Multi-fact modeling | 48% | Connecting multiple fact tables without creating incorrect results |
| KPI definition | High practical importance | Resolving conflicting business definitions |
| Data quality | Common real-world issue | Identifying missing, duplicate, and inconsistent records |
| Stakeholder communication | Critical | Explaining analytical findings clearly |
Important: If these percentages are presented as original survey findings, the published article should provide the survey methodology, sample details, collection date, and supporting source documentation. Do not present them as independently verified industry statistics without evidence.
Why Requirement Gathering Matters More Than Syntax
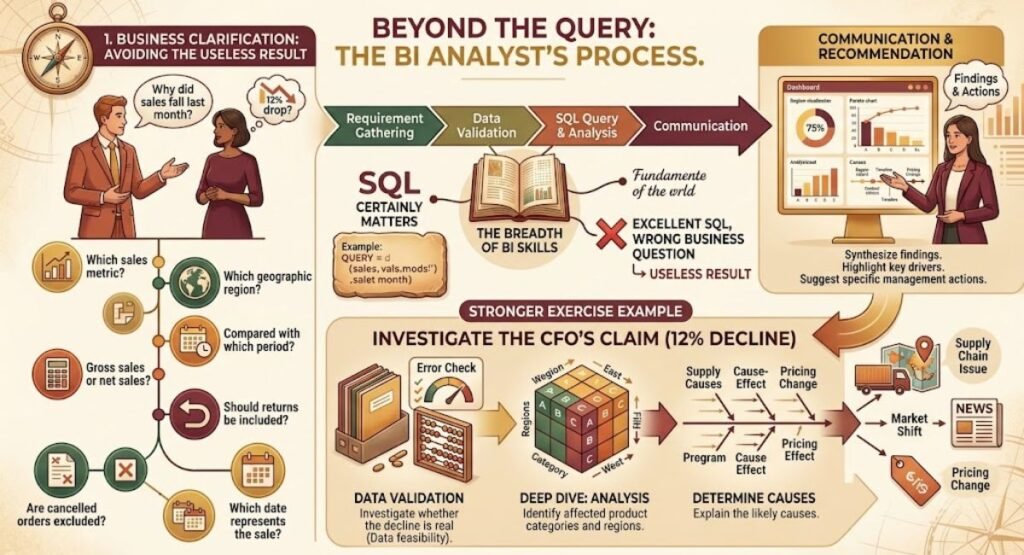
Many beginners assume that the most important BI skill is writing complex SQL.
SQL certainly matters, but an analyst can write excellent SQL against the wrong business question and still produce a useless result.
Consider a manager asking:
“Why did sales fall last month?”
Before querying the database, an analyst should clarify:
- Which sales metric?
- Which geographic region?
- Compared with which period?
- Gross sales or net sales?
- Should returns be included?
- Are cancelled orders excluded?
- Which date represents the sale?
These questions prevent incorrect conclusions.
Business Intelligence Exercise Example
Instead of asking:
“Write a SQL query to calculate monthly sales.”
A stronger exercise asks:
“The CFO believes sales dropped 12% last month. Investigate whether the decline is real, identify the affected product categories and regions, and explain the likely causes.”
This forces the analyst to combine requirement gathering, SQL, data validation, analysis, and communication.
Multi-Fact Table Modeling Exercise
Multi-fact modeling creates another major challenge.
Imagine a business warehouse containing:
- Sales fact
- Inventory fact
- Returns fact
- Shipment fact
- Customer dimension
- Product dimension
- Date dimension
- Warehouse dimension
If an analyst joins multiple fact tables incorrectly, the resulting dataset can multiply records and inflate KPIs.
Example
Suppose a product has:
- 10 sales records
- 5 inventory records
A poorly designed join can produce:
10 × 5 = 50 rows
Instead of the expected analytical relationships.
The exercise should require the analyst to identify the grain of each fact table before calculating metrics.
Case Study: Diagnosing a $2 Million Inventory Leak
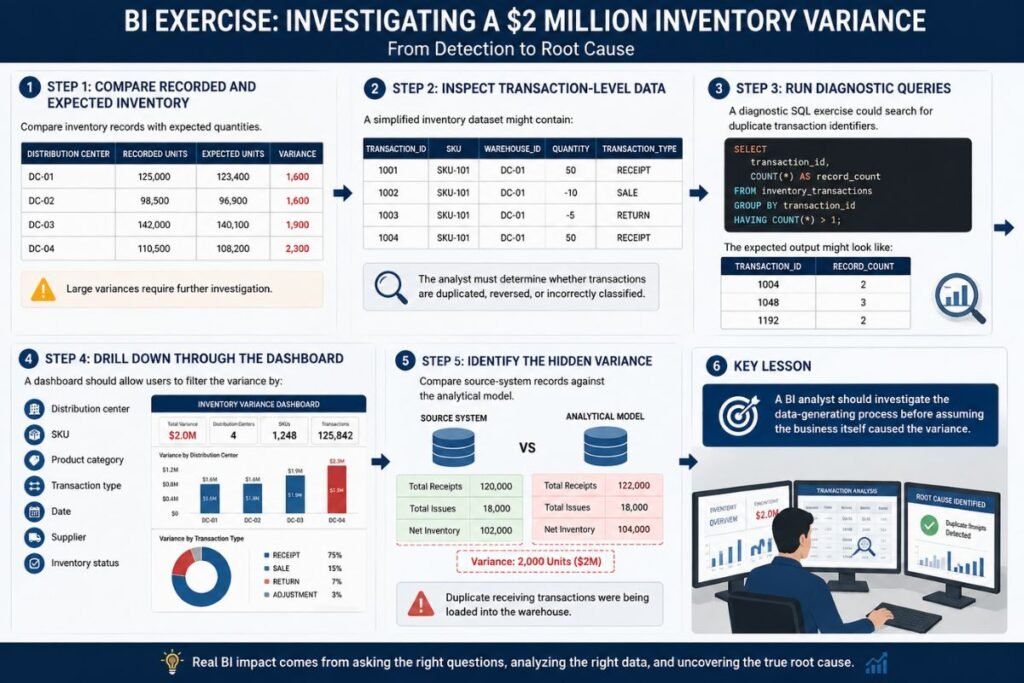
A powerful business intelligence exercise should simulate a high-impact business problem.
Consider a retail enterprise that discovers an apparent $2 million inventory variance across several distribution centers.
Management initially suspects theft or inaccurate physical counts.
The BI team investigates the issue using SQL diagnostics and dashboard drill-downs.
Step 1: Compare Recorded and Expected Inventory
The first analysis compares inventory records with expected quantities.
| Distribution Center | Recorded Units | Expected Units | Variance |
| DC-01 | 125,000 | 123,400 | 1,600 |
| DC-02 | 98,500 | 96,900 | 1,600 |
| DC-03 | 142,000 | 140,100 | 1,900 |
| DC-04 | 110,500 | 108,200 | 2,300 |
Large variances require further investigation rather than an immediate conclusion.
Step 2: Inspect Transaction-Level Data
A simplified inventory dataset might contain:
| transaction_id | sku | warehouse_id | quantity | transaction_type |
| 1001 | SKU-101 | DC-01 | 50 | RECEIPT |
| 1002 | SKU-101 | DC-01 | -10 | SALE |
| 1003 | SKU-101 | DC-01 | -5 | RETURN |
| 1004 | SKU-101 | DC-01 | 50 | RECEIPT |
The analyst must determine whether transactions are duplicated, reversed, or incorrectly classified.
Step 3: Run Diagnostic Queries
A diagnostic SQL query could search for duplicate transaction identifiers.
SELECT
transaction_id,
COUNT(*) AS record_count
FROM inventory_transactions
GROUP BY transaction_id
HAVING COUNT(*) > 1;
The expected output might look like:
| transaction_id | record_count |
| 1004 | 2 |
| 1048 | 3 |
| 1192 | 2 |
The analyst then traces these records back to the distribution center and source system.
Step 4: Drill Down Through the Dashboard
A dashboard should allow users to filter the variance by:
- Distribution center
- SKU
- Product category
- Transaction type
- Date
- Supplier
- Inventory status
This helps analysts move from an enterprise-level variance to the individual records responsible for it.
Step 5: Identify the Hidden Variance
The final diagnostic step compares the source-system records against the analytical model.
The investigation may reveal that duplicate receiving transactions were being loaded into the warehouse.
Instead of treating the $2 million difference as unexplained inventory loss, the BI team can identify the underlying data pipeline or transaction-processing problem.
The key lesson is simple:
A BI analyst should investigate the data-generating process before assuming the business itself caused the variance.
Practice SQL and KPI Sandbox
Interactive exercises can make BI learning significantly more effective.
An embedded practice sandbox can allow readers to:
- Load a sample dataset.
- Inspect table structures.
- Write SQL queries.
- Test KPI calculations.
- Apply filters.
- Compare expected and actual results.
- Identify data-quality problems.
For DAX learners, the same exercise can ask users to create measures such as:
Inventory Variance =
SUM(Inventory[Recorded Quantity])
–
SUM(Inventory[Expected Quantity])
A more advanced challenge could require users to create a percentage variance measure and handle division-by-zero conditions.
Dataset Downloads for Hands-On Practice
A strong BI learning resource should provide datasets that contain both clean and intentionally flawed data.
Useful practice datasets can include:
| Dataset Type | Purpose |
| Clean CSV | Learn basic analysis |
| Duplicate-record CSV | Practice data-quality diagnostics |
| Missing-key dataset | Practice relationship troubleshooting |
| Multi-fact dataset | Practice data modeling |
| JSON dataset | Practice semi-structured data |
| Inventory dataset | Practice anomaly detection |
The flawed datasets are especially valuable because they force learners to diagnose problems instead of simply producing expected outputs.
Architecture Flowchart for BI Exercises
A realistic BI exercise should also demonstrate how data moves through an analytical architecture.
A typical workflow looks like:
Source Systems → Staging → Data Warehouse → Semantic Model → BI Dashboard → Business Decision
Each layer creates an opportunity for errors.
For example:
- Source systems can contain incomplete records.
- Staging processes can introduce duplicates.
- Warehouse transformations can change definitions.
- Semantic models can create incorrect relationships.
- Dashboards can present misleading KPIs.
That is why effective business intelligence exercises should test the entire pipeline.
Before-and-After Dashboard Exercises
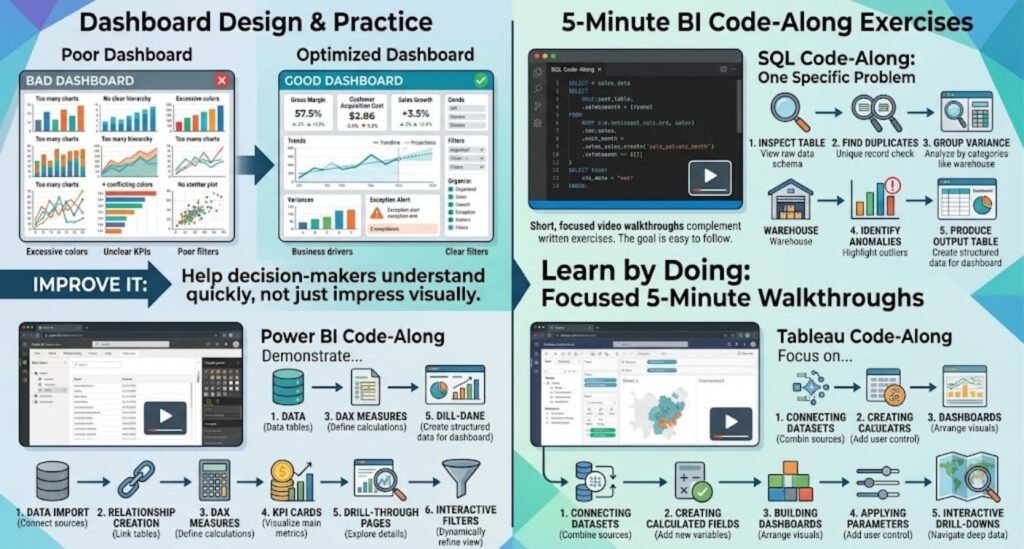
Dashboard design should also form part of BI practice.
A useful exercise can present learners with a poorly designed dashboard and ask them to improve it.
Poor Dashboard
Common problems include:
- Too many charts
- No clear hierarchy
- Excessive colors
- Unclear KPI definitions
- Poor filter organization
- Inconsistent units
- No indication of business priorities
Optimized Dashboard
A better executive dashboard should prioritize:
- Critical KPIs
- Variance indicators
- Trends
- Exceptions
- Business drivers
- Clear filters
- Actionable insights
The goal is not to make a dashboard visually impressive. The goal is to help a decision-maker understand the situation quickly.
5-Minute BI Code-Along Exercises
Short video walkthroughs can complement written exercises.
A five-minute code-along can demonstrate one specific problem from beginning to end.
SQL Code-Along
Show how to:
- Inspect a table.
- Find duplicate records.
- Group variance by warehouse.
- Identify the largest anomalies.
- Produce an output table for the dashboard.
Power BI Code-Along
Demonstrate:
- Data import
- Relationship creation
- DAX measures
- KPI cards
- Drill-through pages
- Interactive filters
Tableau Code-Along
Focus on:
- Connecting datasets
- Creating calculated fields
- Building dashboards
- Applying parameters
- Creating interactive drill-downs
Keeping each video focused on one problem makes the learning experience easier to follow.
Business Intelligence Exercises: Skills to Evaluate
A complete BI exercise should evaluate more than technical execution.
| Skill | Example Evaluation |
| Requirement gathering | Can the analyst clarify an ambiguous request? |
| SQL | Can the analyst extract and validate relevant data? |
| Data modeling | Can the analyst correctly define table grain and relationships? |
| Data quality | Can the analyst identify anomalies and duplicates? |
| KPI development | Can the analyst create reliable business metrics? |
| Visualization | Can the analyst present information clearly? |
| Critical thinking | Can the analyst investigate unexpected results? |
| Communication | Can the analyst explain findings to executives? |
Developing these BI skills can also support long-term assured career progression by helping analysts build stronger technical, analytical, and communication capabilities.
This creates a much more realistic assessment of BI capability.
How to Build Your Own BI Practice Exercise
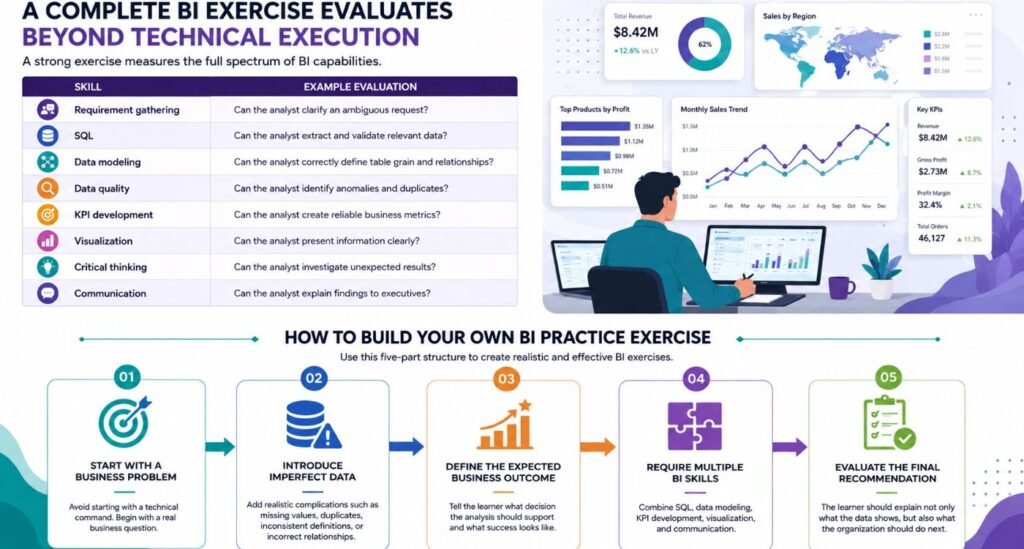
You can create a strong exercise using this five-part structure:
1. Start With a Business Problem
Avoid beginning with a technical command such as “write a SQL query.”
Instead, start with a business question.
2. Introduce Imperfect Data
Add realistic complications such as missing values, duplicates, inconsistent definitions, or incorrect relationships.
3. Define the Expected Business Outcome
Tell the learner what decision the analysis should support.
4. Require Multiple BI Skills
Combine SQL, data modeling, KPI development, visualization, and communication.
5. Evaluate the Final Recommendation
The learner should explain not only what the data shows, but also what the organization should do next.
Conclusion
Effective business intelligence exercises should simulate real workplace problems rather than rely only on clean datasets or isolated SQL questions. The Data-to-Decision methodology helps analysts work through raw data, conflicting definitions, KPI logic, and stakeholder communication.
By combining flawed datasets, diagnostic SQL, multi-fact modeling, interactive dashboards, and realistic case studies, BI practice develops deeper analytical judgment. A strong BI analyst can understand the business problem, validate data, build trustworthy analysis, and turn insights into confident business decisions.
FAQs
What are business intelligence exercises?
Business intelligence exercises are practical scenarios that build skills in data analysis, SQL, data modeling, KPIs, and dashboards.
Are BI exercises useful for beginners?
Beginners can start with simple datasets and gradually progress to complex BI exercises with data-quality issues and ambiguous requirements.
Which tools can I use for BI practice?
Popular BI tools include SQL, Power BI, Tableau, Excel, Python, and cloud data platforms, but effective exercises focus on solving business problems.
What should a good BI exercise include?
A strong BI exercise should include a realistic problem, complex data, clear objectives, analytical constraints, expected outputs, and a final recommendation.
Why should BI exercises include flawed datasets?
Flawed datasets mirror real-world analytics by helping learners identify duplicates, missing values, incorrect relationships, and data-quality issues.
Can BI exercises help with job interviews?
Scenario-based exercises prepare BI candidates for interviews by testing practical reasoning, SQL, data modeling, KPI development, dashboard design, and communication.